

Web Vitals Analysis.
Analysing Core Web Vitals and monitoring on-page optimisation opportunities
Guide contents 12 sections
●Brief01.Core Web Vitals02.LCP: Largest Contentful Paint03.INP: Interaction to Next Paint04.CLS: Cumulative Layout Shift05.Analysing Core Web Vitals06.Web Vitals analysis with Screaming Frog07.Optimising LCP08.Optimising INP09.Optimising CLS10.Screaming Frog and Web Vitals11.Web Vitals video tutorial (in Italian)How to measure the Core Web Vitals of every page by connecting SEO Spider to the PageSpeed Insights API. A refresher on LCP, INP and CLS, how to read lab and CrUX data, and what to do to improve each metric.
Core Web Vitals
Through its connection to the PageSpeed Insights API, Screaming Frog SEO Spider lets you easily measure the Core Web Vitals (CWV) of every page on your website.
The Core Web Vitals are a set of metrics Google introduced in May 2021 to measure key aspects of user experience while a web page loads. They’re a real revolution that helps Google evaluate web pages and assign rankings in search results.
There are currently three metrics: LCP (loading), INP (responsiveness) and CLS (visual stability). Google updates them over time: in March 2024 INP replaced FID as the responsiveness metric.
LCP: Largest Contentful Paint
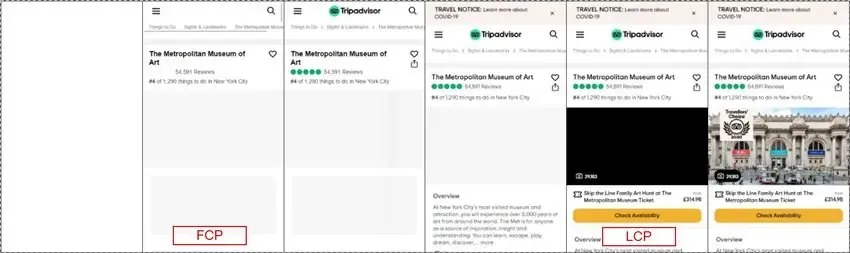
Largest Contentful Paint (LCP) reports the render time of the largest image or text block visible in the viewport, relative to when the page started loading. Google’s benchmark is a maximum of 2.5 seconds for a good, satisfying user experience.
To make sure you hit this target for most of your users, a good threshold is the 75th percentile of page loads, segmented between mobile and desktop.
INP: Interaction to Next Paint
Interaction to Next Paint (INP) measures a page’s responsiveness: how long it takes from a user interaction (a click, a tap, a key press) until the browser shows the response on screen, i.e. the next “paint”.
Since 12 March 2024 INP has replaced First Input Delay (FID) among the Core Web Vitals. FID had two major limitations:
- it only measured the first interaction with the page, ignoring all the others;
- it only measured the input delay, i.e. the wait before the browser started handling the event, not the time to process it and update the page.
INP instead looks at all interactions throughout the visit and, for each one, adds up three phases:
- Input delay: the wait before the event handlers start, usually because the main thread is busy with other scripts;
- Processing time: the time to run the JavaScript tied to the interaction;
- Presentation delay: the time the browser needs to recalculate the layout and paint the new frame.
The final value is the slowest interaction of the visit (on pages with lots of interactions Google discards outliers). It’s therefore a much stricter and more realistic metric than FID: a page can respond well to the first click but freeze when the user opens a filter or adds a product to the cart.
User interactions slow down mostly when the browser is busy with other tasks. In the timeline below the long tasks, activities that occupy the main thread for more than 50 ms, are highlighted: if the user clicks while one is running, the response only arrives once the task has finished.

For a good browsing experience, Google says INP should be 200 milliseconds or less; between 200 and 500 ms the page needs improvement, and above 500 ms responsiveness is poor. To make sure you hit this target for most of your users, a good threshold to measure is the 75th percentile of page loads, segmented between mobile and desktop.
CLS: Cumulative Layout Shift
Cumulative Layout Shift (CLS) is a very important user-centric metric that measures the visual stability of a layout while an HTML page loads. It was introduced to limit annoying unexpected shifts caused, for example, by ad banners. We’ve all had the frustrating experience of reading a news site and having the article text jump down while the page loads; CLS measures exactly that instability.
Below you can see this happening as the browser loads the page. With each frame new content is added, pushing the earlier elements up and down.
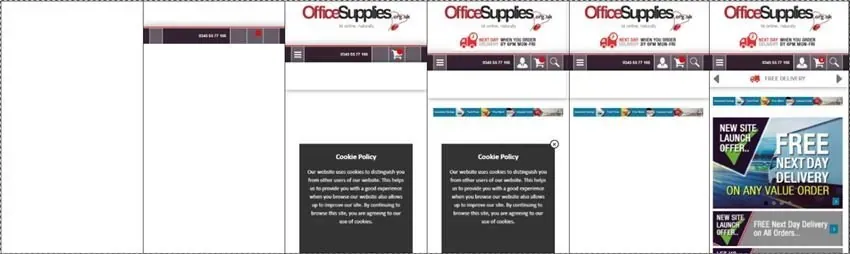
For a good user experience, sites should aim for a CLS score of 0.1 or less. To make sure you hit this target for most of your users, a good threshold to measure is the 75th percentile of page loads, segmented between mobile and desktop.
The Core Web Vitals are based on real data from the Chrome User Experience Report (CrUX) covering the last 28 days, built on users’ visits to a page.
Each Web Vital is rated in one of three categories: Good, Needs Improvement and Poor.
For a page to pass the Core Web Vitals Assessment it must be “Good” on all three metrics.
These are the thresholds for each metric, measured at the 75th percentile:
| Metric | Good | Needs Improvement | Poor |
|---|---|---|---|
| LCP (loading) | ≤ 2.5 s | 2.5 – 4 s | > 4 s |
| INP (responsiveness) | ≤ 200 ms | 200 – 500 ms | > 500 ms |
| CLS (visual stability) | ≤ 0.1 | 0.1 – 0.25 | > 0.25 |
Analysing Core Web Vitals
Websites’ Core Web Vitals are recorded and stored in the Chrome User Experience Report, and there are essentially two ways to view them.
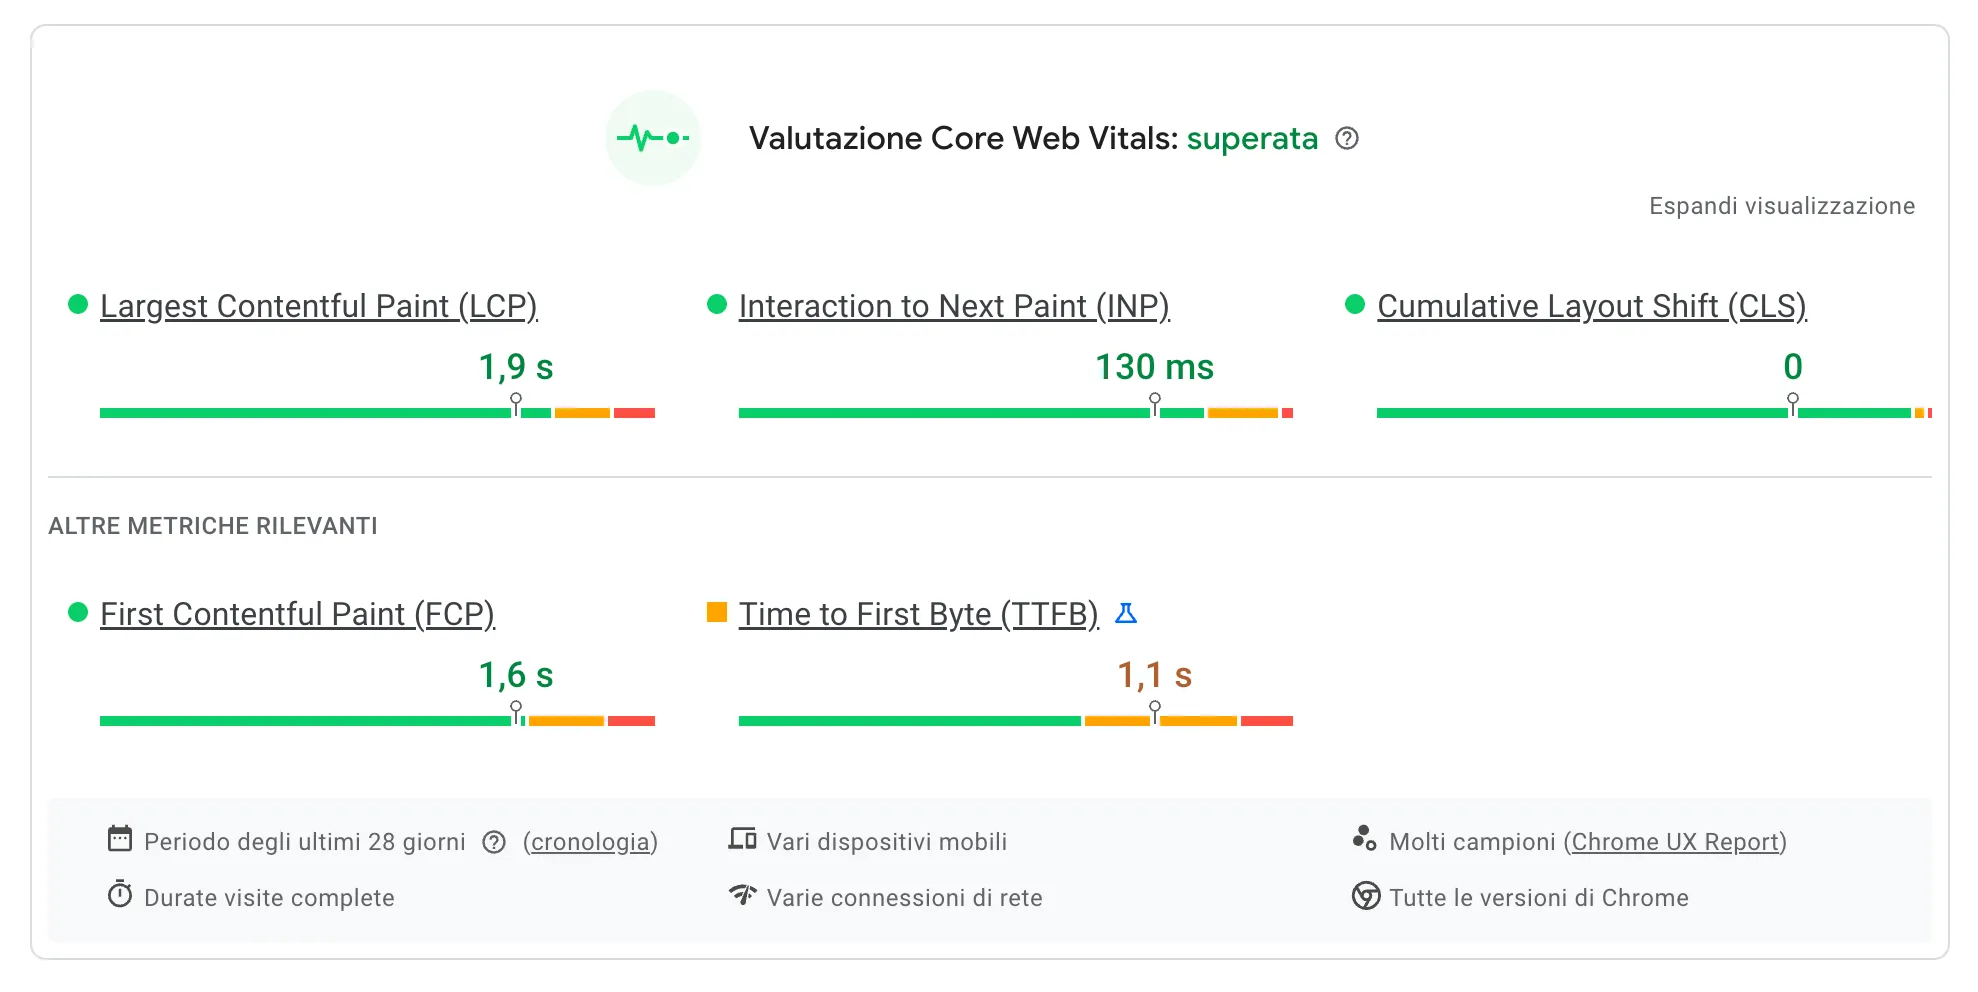
For a single URL you can use PageSpeed Insights (PSI), which tells you whether the page passed or failed the checks.
The second option is the “Core Web Vitals” section of Search Console, which reports page performance, errors and warnings for these metrics.
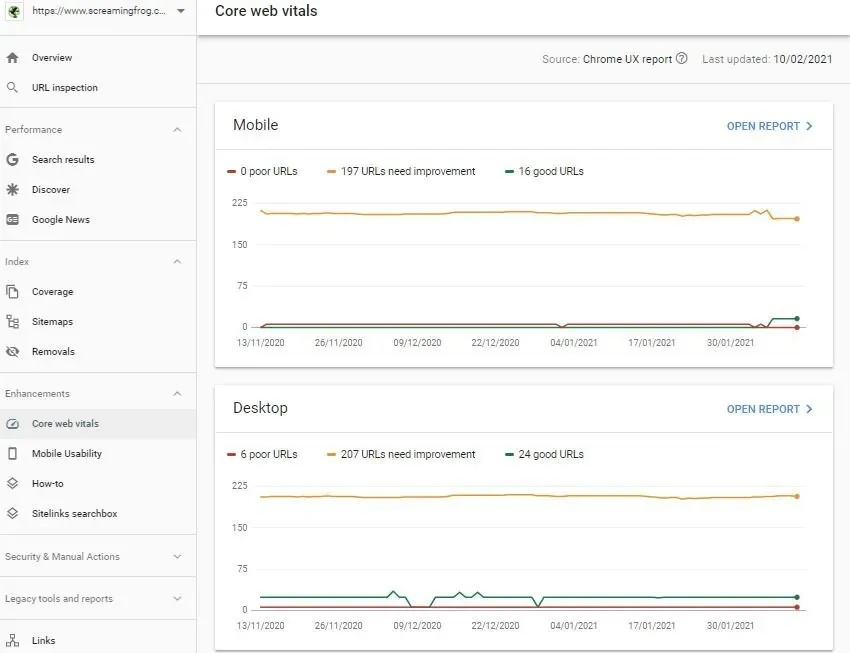
Although both checks work, they’re also very limited: the first only checks one URL at a time, while GSC groups several URLs (URL templates) and doesn’t give individual quality scores.
Web Vitals analysis with Screaming Frog
Thanks to its connection to the PageSpeed Insights API, Screaming Frog SEO Spider collects Web Vitals data easily and gives you specific data for each URL, based on real CrUX data and lab data. Setting it up takes just a few simple steps.
-
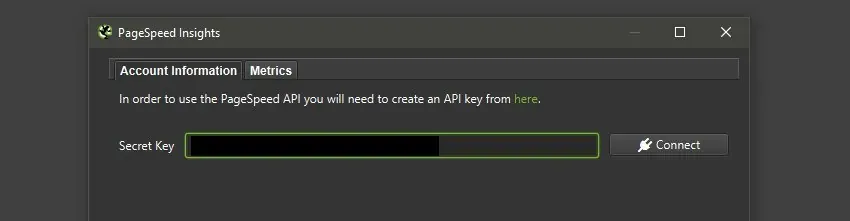
- Connect to the PageSpeed API: go to 1Configuration›2API Access›3PageSpeed Insights, enter your Secret Key and click Connect.
-
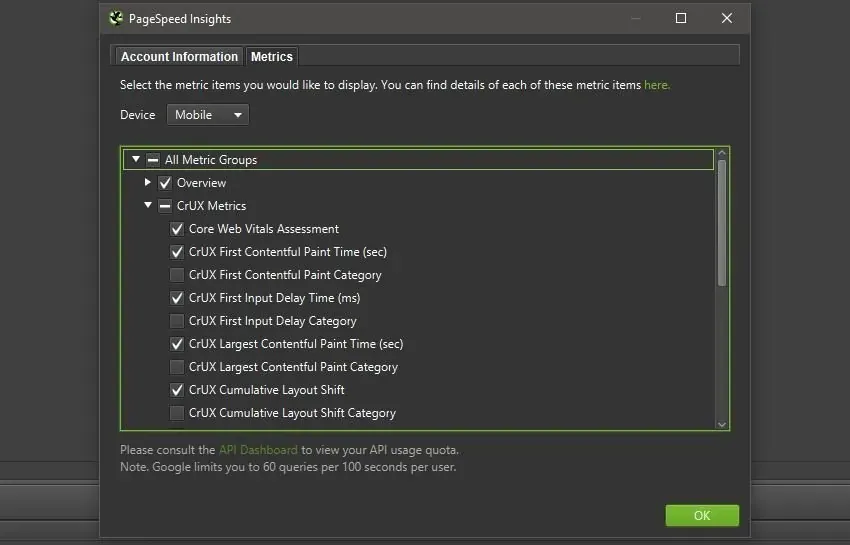
- Choose the metrics.
Once connected to PSI, click the “Metrics” tab and choose which to include in the analysis. For your first Core Web Vitals crawls I recommend the default selection, as it includes CrUX report data, Google Lighthouse lab data and the opportunity data for areas to improve.
-
- Run the crawl.
With the API metrics configured, start the crawler and wait for the website to be crawled and populated with Core Web Vitals data.
-
- Analyse the data
Now click the PageSpeed tab to see all the crawl details: which URLs passed the test, which need improving and which have serious issues.
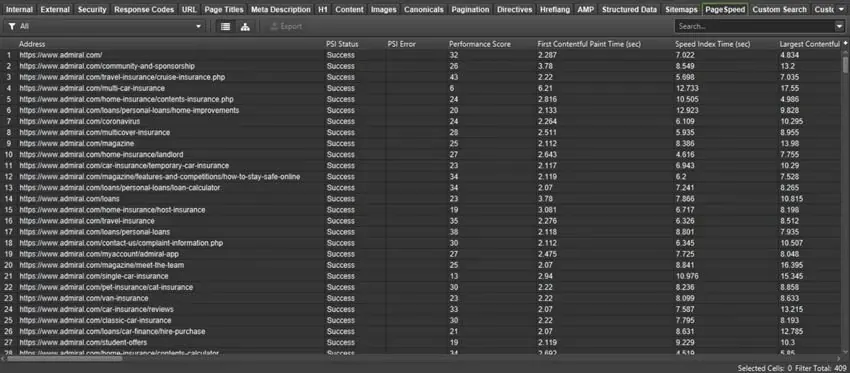
In the example above (default settings) the first column shows the URLs and the second the “Core Web Vitals Assessment” status. The PSI status is marked “Pass” or “Fail” depending on whether the page is good on all three Web Vitals.
In the screenshot you can see that the top URL has an LCP of 1.99s (under 2.5s), a responsiveness value of 37 ms (FID at the time, now replaced by INP with a 200 ms threshold) and a CLS of 0.06 (under 0.1), so it passed CWV validation.
This overview lets you see straight away which pages failed and which specific CWV metrics need work.
Some URLs may get no CWV data: this happens when there isn’t enough speed data in CrUX, because the page doesn’t get enough visitors. Usually only the most popular pages have enough data for the Chrome UX Report.
-
- Segment the error patterns
With the data in hand you can examine each CWV metric using different filters, isolating the issues to optimise and getting every URL that shares the same problem.
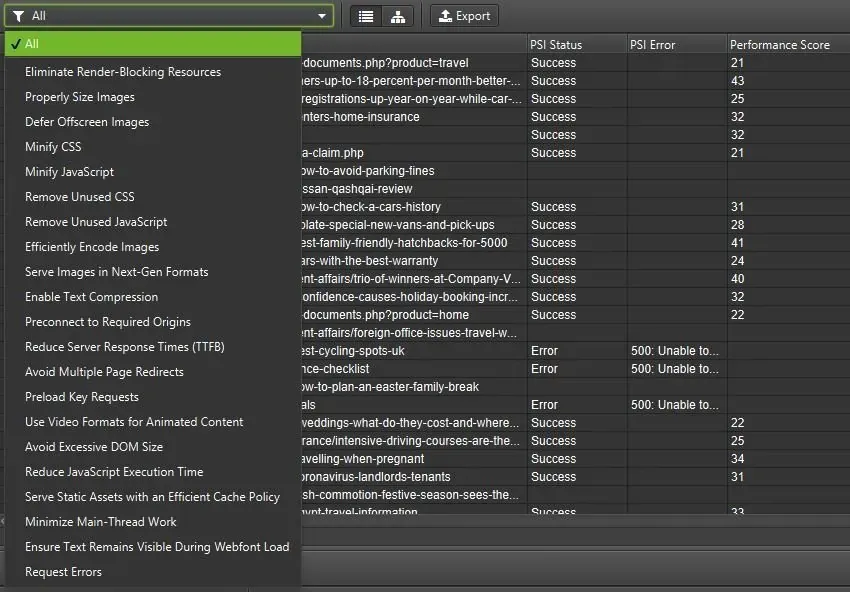
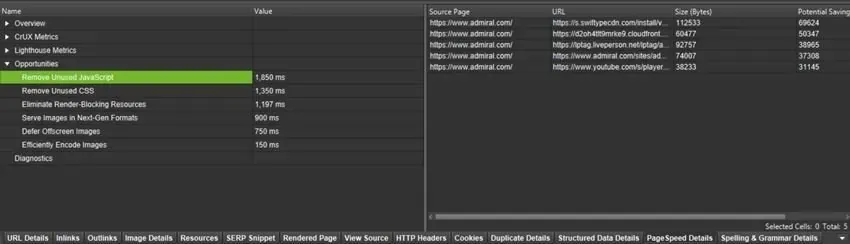
Select a URL in the top window and click the “PageSpeed Details” tab (bottom window) to find a whole set of extra details and opportunities for fixing the errors or warnings found.
Optimising LCP
Let’s start by identifying the areas that affect LCP and the factors you can optimise to improve the metric.
- Properly Size Images.
- Defer Offscreen Images.
- Efficiently Encode Images.
- Serve Images in Next-Gen Formats.
The starting point is images, one of the cornerstones of HTML page performance. To improve LCP, make sure every image is correctly sized and use lazy loading where appropriate.
It’s worth using newer, more efficient image formats such as WebP and improving the encoding of existing image files.
Server response time also has a big impact. An underpowered server means slow responses and longer load times; that’s why I recommend choosing faster hosting or using CDNs (Content Delivery Networks) to cut response times and improve TTFB.
Among the possible optimisations, pay close attention to resources that block page rendering. As you know, while the HTML is being parsed, every reference to stylesheets can pause the parser, delaying LCP.
Ideally you should defer any non-critical CSS and JavaScript to speed up loading of your main content, and use “preload” for critical resources. Another tip is to minify CSS and JavaScript and remove any unnecessary files from your page load; also consider “preconnect” for third-party resources (e.g. Google Analytics, Tag Manager).
- Minify CSS.
- Minify JavaScript.
- Remove Unused CSS.
- Remove Unused JavaScript.
- Enable Text Compression.
- Preconnect to Required Origins.
- Preload key Requests.
- Use Video Formats for Animated Content.
Optimising INP
In most cases INP gets worse because of long execution times of large scripts, which keep the main thread busy just when the user interacts. The first step is to minify and remove unused parts of scripts (or whole scripts), reducing the time spent running and rendering these files.
- Minify JavaScript.
- Remove Unused JavaScript.
- Reduce the Number of Third-Party Scripts Used.
To find the list of third-party resources, check your HTML document in the PageSpeed Details tab.
Another optimisation concerns main-thread work. If the browser is busy rendering on the main thread, the user can’t interact with the page until it’s done. Reducing main-thread execution time makes user interactions more responsive and immediate.
The main solutions involve reducing JavaScript execution and main-thread work. For INP in particular:
-
break long tasks into shorter ones, yielding control to the browser (for example with
scheduler.yield()orsetTimeout), so interactions don’t sit in a queue; -
keep event handlers light and defer non-urgent work until after the paint;
-
reduce DOM size, because a very large DOM lengthens layout recalculation after every interaction (Avoid Excessive DOM Size).
-
Minimise Main-Thread Work
-
Reduce JavaScript Execution Time
Remember too that every resource a page needs takes time to request, download and run. Reducing both the number of requests and the total download size helps improve page execution times.
Useful actions here are minifying CSS and JavaScript, removing unused stylesheets and JavaScript, and text compression.
- Lower Resource Counts & Sizes.
- Minify CSS.
- Minify JavaScript.
- Remove Unused CSS.
- Remove Unused JavaScript.
- Enable Text Compression.
Optimising CLS
As mentioned earlier, layout stability is the core of CLS and key to a great user experience: focus on serving the page in the right order, with defined space for each resource, so browsing doesn’t jump around.
To get good results, make sure all images, ads, videos and iframes have <height> and <width> attributes, so pages load with the right spacing and other content doesn’t shift when they’re added. Another CLS consideration is to prioritise loading resources from top to bottom, so users who have already scrolled down aren’t bounced back up.
Make sure custom fonts don’t cause FOIT/FOUT: if custom fonts are applied late in the page load, text may flash as it’s swapped (FOUT), or invisible text may show until the custom font renders (FOIT). To avoid this delay I recommend using “preload” for critical resources.
Screaming Frog and Web Vitals
If your URLs show no CrUX data and the PSI status says ‘success’, the URL probably doesn’t get enough real user visits to generate enough speed data for the CrUX report. If you find yourself in this situation after crawling with Screaming Frog, you could analyse a page with a similar layout that does have CrUX data, or use the simulated lab data (included by default in SEO Spider’s configuration).
When you have to use lab data, the only metric not available is INP, because Lighthouse doesn’t simulate real user interactions. In that case use Total Blocking Time (TBT) as an indicator: it measures how long the main thread is blocked by long tasks during loading and correlates strongly with INP, so the resources that push it up are the first to optimise.
If you need to analyse a very large site, you may exceed the PageSpeed Insights quota. In that case I recommend analysing a significant sample or waiting for the quota to reset.
Don’t forget that CrUX data is based on the last 28 days of user interactions, so any change to the site will take 28 days to show up in CrUX.
Web Vitals video tutorial (in Italian)
Questions about Web Vitals Analysis?
These guides come from real projects. If something in your crawl doesn’t add up, or you want to apply this process to your site, get in touch.
 Author.Raffaele Visintin.Search & Strategic Marketing Advisor
