

PageSpeed.
Analysing performance and Core Web Vitals to improve search engine rankings.
What you’ll find in SEO Spider’s PageSpeed tab: Lighthouse lab metrics and real CrUX data through the PageSpeed Insights API, opportunity filters and report exports.
PageSpeed Insights overview
Today a website’s performance is vital for organic ranking in Google’s SERPs, a trend reinforced by the Core Web Vitals (LCP, INP and CLS), which became ranking factors in 2021.
SEO Spider’s “PageSpeed” tab helps you collect data from two sources:
- PageSpeed Insights, which uses Lighthouse to test page speed with “lab data”;
- the Chrome User Experience Report (CrUX, or “field data”), which gives you real browsing data.
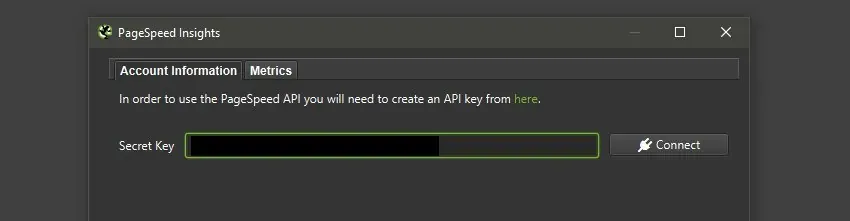
To populate the “PageSpeed” tab you need to connect the PSI API from 1Configuration›2API Access›3PageSpeed Insights.
The metrics
The PageSpeed tab gives you several general metrics:
- Total Size Savings.
- Total Time Savings.
- Total Requests.
- Total Page Size.
- HTML Size.
- HTML Count.
- Image Size.
- Image Count.
- CSS Size.
- CSS Count.
- JavaScript Size.
- JavaScript Count.
- Font Size.
- Font Count.
- Media Size.
- Media Count.
- Other Size.
- Other Count.
- Third Party Size.
- Third Party Count.
More specific metrics are split between “CrUX Metrics”, Chrome’s field data, and “Lighthouse Metrics”, lab data from PageSpeed Insights.
CrUX metrics
For each metric you get the value and the category (Good, Needs Improvement, Poor), both for the URL and for the whole origin:
- CrUX Performance.
- CrUX Largest Contentful Paint Time (sec).
- CrUX Interaction to Next Paint (ms).
- CrUX Cumulative Layout Shift.
- CrUX First Contentful Paint Time (sec).
- CrUX Time to First Byte (ms).
- CrUX Origin Performance and the same metrics for the origin.
Since 12 March 2024 INP has replaced First Input Delay (FID) among the Core Web Vitals.
Lighthouse metrics
- Performance Score.
- Time to First Byte (ms).
- First Contentful Paint Time (sec) and Score.
- Speed Index Time (sec) and Score.
- Largest Contentful Paint Time (sec) and Score.
- Total Blocking Time (ms) and Score.
- Cumulative Layout Shift and Score.
Total Blocking Time is the lab proxy for INP, which can’t be measured without real interactions. Metrics such as Time to Interactive, First Meaningful Paint, First CPU Idle and Estimated Input Latency have been removed from Lighthouse.
PageSpeed filters
As well as the metrics, the tab includes the following filters:
- Eliminate Render-Blocking Resources: shows all pages with resources blocking the page’s “First Paint”, along with the potential savings.
- Properly Size Images: highlights all pages with incorrectly sized images and the potential data savings if they were fixed.
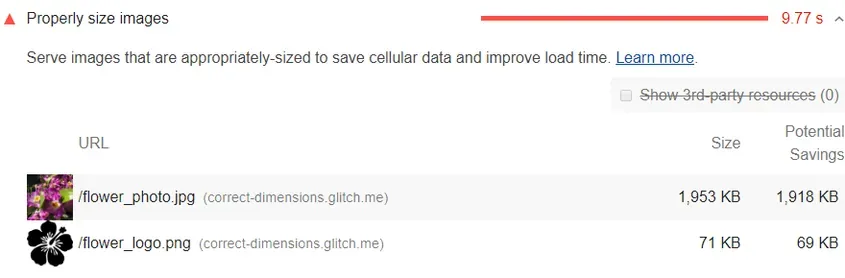
Ideally your page shouldn’t serve images larger than the version rendered on the user’s screen. The best strategy is to serve “responsive images”, generating several versions and specifying which to use in your HTML or CSS with media queries, viewport sizes and so on.
Other solutions include using an image CDN or vector SVG formats that scale to any size, for icons for example.
- Defer Offscreen Images: identifies all pages with hidden or offscreen images, along with the potential savings. To fix this, consider “lazy-loading” these images after critical resources to lower “Time to Interactive”.
- Minify CSS: all pages with unminified CSS files, along with the potential savings if they were minified properly.
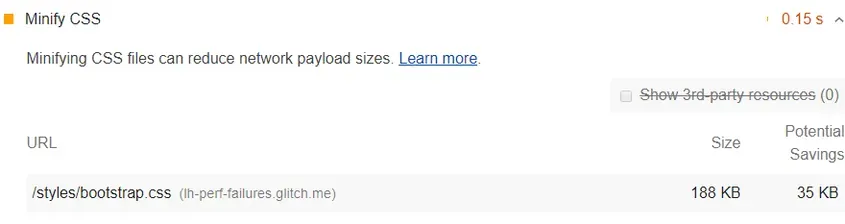
Minifying CSS improves page load time, because the CSS used is usually larger than it needs to be. CSS files can contain unnecessary characters such as comments, whitespace and indentation.
When going live, these characters can safely be removed to reduce file size without affecting how the browser processes the styles. This technique is called minification.
/* Header background should match brand colors. */
h1 {
  background-color: #000000;
}
h2 {
  background-color: #000000;
}
This code can be minified to a single line:
h1,h2{background-color:#000000}- Minify JavaScript: shows all pages with unminified JavaScript files, along with the potential savings. Minifying JavaScript files can reduce payload size and script parsing time.
Minification is the process of removing whitespace and any code that isn’t needed, to create a smaller but perfectly valid file. For example, Terser is a popular JavaScript compression tool. webpack v4 includes a plugin for this library by default to create minified build files. - Remove Unused CSS: identifies pages with unused CSS, along with the potential savings in bytes. Developers usually add a page’s stylesheets like this:
<!doctype html>
<html>
<head>
  <link href="main.css" rel="stylesheet">
The main.css file the browser downloads is called an external stylesheet and is stored separately from the HTML that references it. So whenever a browser meets this, it has to download, parse and process every external stylesheet it finds before it can show any content on the user’s screen.
- Efficiently Encode Images: shows pages with unoptimised images, along with the potential savings. Lighthouse collects all the JPEG or BMP images on the page, sets each image’s compression level to 85 and compares the original with the compressed version. If the potential saving is 4 KiB or more, Lighthouse flags the image as optimisable.
- Serve Images in Next-Gen Formats: highlights pages with images served in older formats such as JPEG and PNG. The advice is to use formats like AVIF and WebP, which offer better compression and quality.
- Enable Text Compression: all pages with text-based resources that haven’t been compressed, along with the potential savings.
- Preconnect to Required Origin: identifies all pages that connect to domains other than yours but don’t yet prioritise fetch requests with link rel=preconnect, along with the potential savings. Before requesting a resource from a server, the browser has to establish a connection: look up the domain name and resolve it to an IP address, set up a connection to the server and encrypt it. At each of these steps the browser sends data and receives responses from the server; this is called a “round trip” and, depending on network conditions, takes time that inevitably affects performance.
To optimise this, you can “preconnect” to external resources (connections to other domains), telling the browser which resources to connect to first because they’re a priority.
<head>
  <link rel="preconnect" href="https://domain.com">
</head>

<!-- The same hint can be sent with an HTTP header -->
Link: <https://domain.com>; rel=preconnect
One use of “preconnect” could be for Google Tag Manager or Google Analytics:
Link: <https://www.google-analytics.com>; rel=preconnect; crossorigin
Link: <https://www.googletagmanager.com>; rel=preconnect; crossorigin
“Critical request chains” are a series of dependent network requests that are important for rendering the HTML document correctly.
- Reduce Server Response Times (TTFB): load speed is essential for a good user experience, and users are very sensitive to it. A site that takes many seconds to load has abandonment rates to match. One of the most common causes is slow server responses when returning the page content to the browser. This filter identifies all pages where the browser had to wait more than 600 ms for the server to respond to the main document request.
- Avoid Multiple Redirects: shows pages with resources that redirect, and the potential savings from using the direct URL. Redirects slow down page load. When a browser requests a resource that has been redirected, the server usually returns an HTTP response like this:
HTTP/1.1 301 Moved Permanently
Location: /path/to/new/location
and the browser has to make another HTTP request to fetch the resource at its new location. This isn’t meant to ban 3xx responses, but to avoid redirect chains or multiple redirects on the same page.
Always avoid redirects on resources needed for the “Critical Rendering Path”.
- Preload Key Requests: identifies HTML pages with elements that could be handled with “preload”.
When a page is requested, the browser asks the server for the HTML page, parses its content and sends separate requests for each resource referenced in the document. To improve performance it’s best to speed up this process by requesting critical resources early.
One example is a font requested in a CSS file, since the browser would only discover it after reading the stylesheet. With “preload” you preload and fetch a resource the browser would otherwise only consider later, for example in critical request chains.
Remember that the browser caches the “preloaded” resource without running scripts, but having already fetched them it will serve them immediately when they’re requested.
This is well suited to dependencies such as JS, fonts and CSS.
This feature is a browser hint that doesn’t block the loading of the HTML document. To implement “preload”, just add the <link> tag in the <head> of the HTML or use the HTTP Link header.
<!-- In the head section -->
<link rel="stylesheet" href="styles/main.css">
<link rel="preload" href="main.js" as="script">

<!-- With the HTTP header -->
Link: </css/style.css>; rel="preload"; as="style"- Use Video Format for Animated Images: identifies pages with animated GIFs, along with the potential savings if converted to video.
- Avoid Excessive DOM size: identifies all pages whose DOM exceeds the recommended 1,500 total nodes. The DOM matters a great deal because it can hurt performance in several ways:
- the DOM often includes many nodes the user can’t see when the page first loads; this needlessly increases the amount of data served and slows load time (load performance).
- during browsing there are many interactions with the page from users and scripts that make the browser recalculate the position and style of DOM nodes, slowing rendering (runtime performance).
- if JavaScript uses general query selectors such as document.querySelectorAll(‘li’), it may unknowingly store references to a very large number of nodes, which can overwhelm the memory of users’ devices (memory performance).
- Reduce JavaScript Execution Time: flags pages with medium or slow JavaScript execution time. When an HTML page spends a long time running JavaScript, performance suffers:
- network cost rises: more bytes mean longer download time.
- JavaScript is parsed and compiled on the main thread, which isn’t available for user interaction.
- by occupying the main thread, JavaScript also delays TTI (Time to Interactive), hurting the page’s UX and the related web vital.
- if JavaScript holds many references it can consume a lot of memory, making the page harder to use.
To improve JavaScript performance, the general advice is to minify and compress the code, remove unused code and cache it.
- Serve Static Assets With An Efficient Cache Policy: returns all pages with resources that aren’t cached, along with the potential savings. When a browser requests a resource, the server can tell it how long to store or cache the resource. For each later request for that resource, the browser uses its local copy rather than fetching it from the network. Lighthouse considers fonts, media, images and stylesheets that return a 2xx status code and haven’t explicitly declared a “no-cache” policy.
Here’s an example of caching through an HTTP header:
Cache-Control: max-age=31536000The “max-age” directive tells the browser how long a resource stays in the cache. For static assets, at least one year is recommended.
- Minimize Main-Thread Work: identifies all pages with medium or slow main-thread execution times that hamper rendering of the HTML document. The browser’s rendering process turns your code into a web page users can interact with. By default the main thread of the rendering process handles most of the code: it parses the HTML and builds the DOM, parses the CSS and applies the styles, and parses, evaluates and runs the JavaScript.
The main thread also processes user events. So whenever the main thread is busy doing something else, the page may not respond to user interactions, leading to a poor experience. To improve this, optimise third-party JavaScript, remove unused code, reduce and simplify (minify) CSS, defer non-critical CSS and split JavaScript payloads.
- Ensure Text Remains Visible During Webfont Load: all pages with fonts that may flash or become invisible while the resource loads.
- Reduce Unused JavaScript: pages with JavaScript that is loaded but not used, with the potential savings.
- Avoid Serving Legacy JavaScript to Modern Browsers: pages that send unnecessary polyfills and transforms to modern browsers.
- Avoid Large Layout Shifts: pages with elements that cause layout shifts, related to CLS.
- Image Elements Do Not Have Explicit Width & Height: images without explicit dimensions, a common cause of CLS.
Exporting performance data
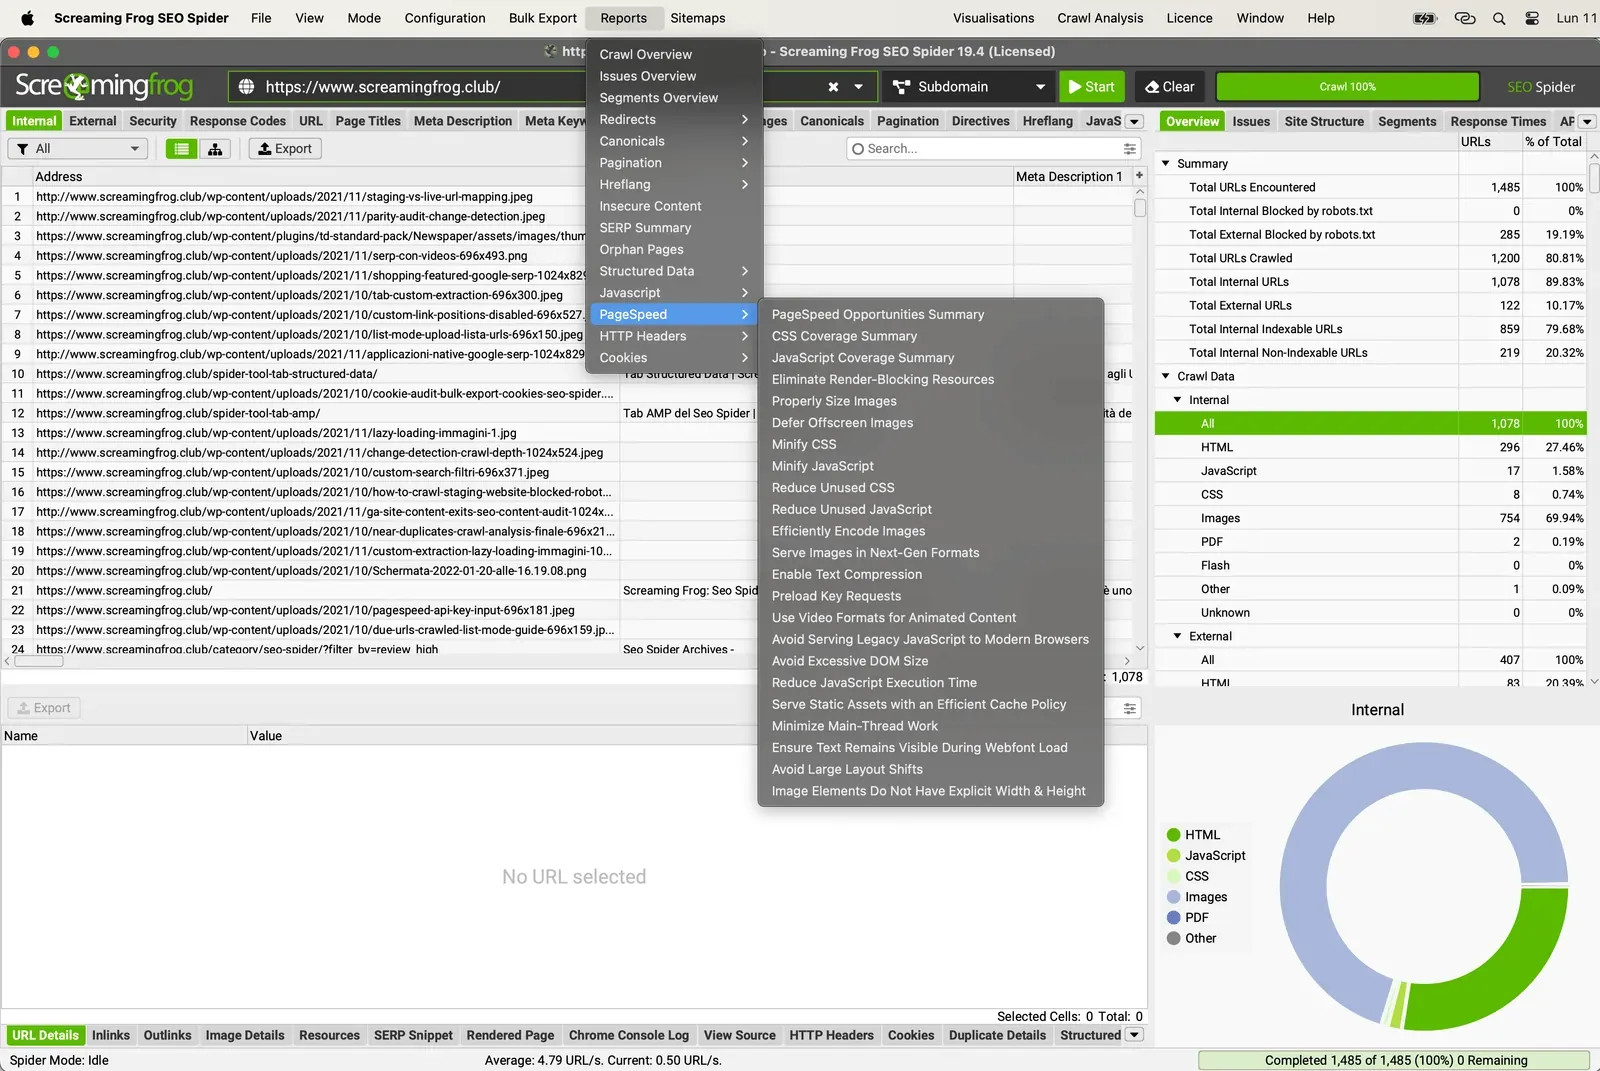
You can bulk export all performance data, source pages and the URLs of resources that could be optimised from the 1Reports›2PageSpeed menu.
Questions about PageSpeed?
These guides come from real projects. If something in your crawl doesn’t add up, or you want to apply this process to your site, get in touch.
 Author.Raffaele Visintin.Search & Strategic Marketing Advisor
